Burning Forests: Tools for Tracking and Reporting Wildfire Damage

The article discusses methods for tracking and reporting wildfire damage using open-source tools and satellite imagery. It highlights the work of Galen, an Investigative Technologist at Bellingcat, and Wim Zwijnenburg, a Humanitarian Disarmament Project Leader for PAX, who focus on environmental crimes and conflict-related environmental issues.
NASA’s fire-tracking tool is often the first resource for detecting wildfires, providing heat signatures and approximate locations. However, the article emphasizes that detection is just the beginning; analyzing and reporting the scale and severity of wildfires—especially in protected areas with fragile ecosystems—is crucial. The guide also explores how recurring fires in the same regions over multiple seasons can reveal patterns in fire activity, particularly as climate change increases fire risks worldwide.
The case study of Sicily’s Zingaro Nature Reserve, severely affected by wildfires in July 2025, is used throughout the guide. Satellite imagery from Copernicus Browser and vegetation health indices help assess burn severity, with data combined in QGIS for deeper analysis. The article provides step-by-step instructions for visualizing and measuring wildfire damage.
Using Sentinel-2 imagery, true-color and false-color images help distinguish between healthy vegetation and burned areas. False-color imagery, which captures non-visible light bands, is particularly useful for identifying burn scars. The Normalized Burn Ratio (NBR) index further quantifies burn severity by comparing pre- and post-fire vegetation reflectivity.
In the Zingaro Nature Reserve case, the fire burned over 50 square kilometers and was classified as moderately severe based on NBR changes. The article also suggests using QGIS to estimate the proportion of protected areas affected by overlaying NBR data with global protected area datasets from Protected Planet.
The guide encourages readers to replicate these methods independently, citing examples like wildfires in Chile (January 2026) and Etosha National Park (September 2025). By combining satellite imagery, burn severity indices, and geographic analysis tools, investigators can produce clear, reportable findings on wildfire impacts, particularly in ecologically sensitive regions.
Comments (0)
No comments yet — be the first to weigh in.
Related Coverage
 World
World
Slow start makes me want to stay - Norris extends McLaren deal to 2030
Lando Norris has signed a contract extension with McLaren, committing to the team through at least the end of the 2030 Formula 1 season. The 26-year-old British...
 World
World
Wales NHS gender surgeries paused for review into referral numbers
The Welsh Gender Service, based at St David’s Hospital in Cardiff, has temporarily suspended all new and scheduled referrals for gender-affirming surgeries as h...
 World
World
At least 37 dead and hundreds evacuated after strike on Kyiv warehouse
At least 37 people have been killed and nearly 400 evacuated after a Russian drone strike triggered explosions at a warehouse in the Kyiv region late Friday, Uk...
 World
World
Sarah Ferguson Expected to Return to UK Soon, Source Says
Former Duchess of York Sarah Ferguson, who lost her royal titles amid the Epstein scandal, is expected to return to the UK soon, a source told the BBC.
Most Read

Tottenham Hotspur sign Omar Marmoush on loan from Man City with permanent deal option

Nepal Flash Floods Death Toll Rises to 626, Over 2,400 Missing
Nicole Rifkin’s New Yorker Cover Honors Dolly Parton’s Legacy
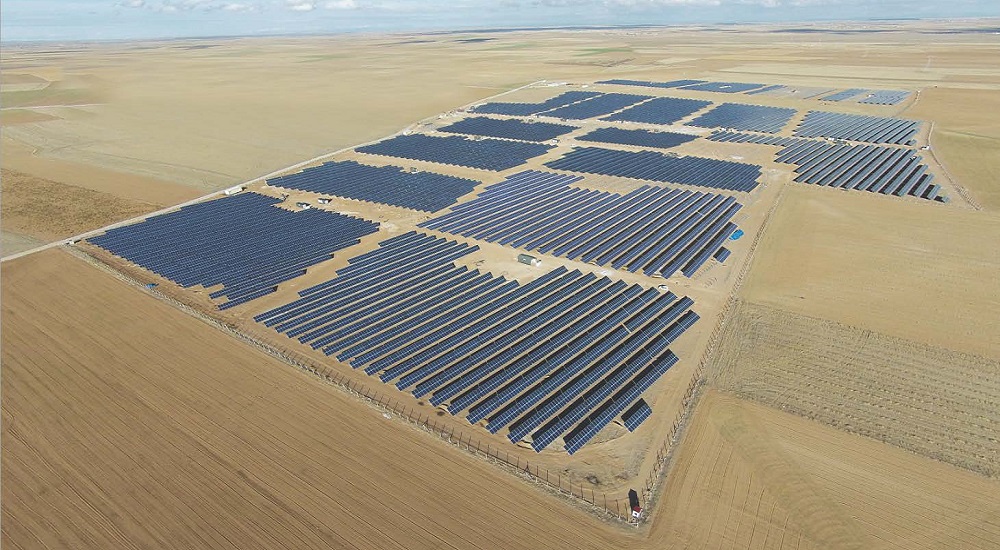
Machine Learning Boosts Irradiance Prediction for Bifacial Solar Panels